This article by Justin Bourne was posted recently, and shared in a comment in another thread.
I find it exciting and think it is worth calling attention to it.
It gives some detail on exactly the type of data that will help enhance the limited or simplistic xG stats currently in use today, and even mentions your Calgary Flames!
We have had many discussions about the limitations of xGA this season.
Some things we have discussed, and that I have personally noted when discussing the Flames is basically that the current methods do not give
- sufficient granularity in the play leading up to the opportunity
- the defending team’s defensive posture / coverage (Flames’ lapses!)
- what the goalie has to do to save the puck, including
- where the actual shot is placed by the shooter
Check it out. Very exciting and worthwhile, as they are talking about how to include the first 3 of 4
Some highlights - he starts discussing Matt Murray in a .8xx sv% game, pivots to the Flames
The gist with respect to Murray was that Murray thought he played fine and Keefe excused the goals
Quote:
"I think he's been great. The numbers look terrible, but again, here tonight, I thought he looked really good. I mean, it's four tap-ins. They're three feet or less in front of the crease."
The pivot to discuss the Flames
Quote:
On the offensive side of this same quality of scoring chance conversation sit the Calgary Flames, who have done a remarkable job making unestablished goaltenders look like peak-era Dominik Hasek
(Lists these 12 relatively unaccomplished goalies)
One thing access to deeper data has allowed us to recognize is the Flames are not just some unlucky team that’s due some positive breaks, but rather one that creates a lot of shots that aren’t overly dangerous. They generate in bulk from outside the slot – the most in the NHL – but are in the bottom half of the league at getting them from the inner slot.
Then he goes on to discuss the limitations of current xGA methods
Quote:
Analytics work that aims to quantify the quality of chances created has come a long way, and as a result, “expected goals” is now a reasonably common and accepted stat in the public discourse. It evaluates several factors such as shot location and considers influences such as “rush” or “rebound” to measure the likelihood of those attempts converting into goals. As a stat “expected goals” has its imperfections (as many stats do), but over larger samples there’s useful information there.
Then it goes on to elaborate on things that can be done with the tracking chips
Quote:
I only point out the imperfections because expected goals is purely a proxy that relies on comparable shots from comparable spots/scenarios and how often those kinds of attempts typically go in. To focus measurements more finely, there are a bunch of factors that would require puck and player tracking…
…which we now have.
With microchips in pucks and jerseys we should eventually be able to:
• create a version of expected goals that allows us to show how a created chance is more valuable when it’s taken by a totally unmarked player, rather than one with two defenders in the immediate vicinity of the shooter.
• tell that a shot following a cross-ice laser pass is more dangerous than one off a pass that’s gently slid across the ice
• And of course, be able to tell that when a goalie’s been juked out of his jock with a shoulder fake or no-look pass, the resulting attempt on a wide-open net is more likely to go in than one where the goalie is square to the shooter.
Some of the factors that create quality chances are repeatable skills, but we haven’t yet had the information to build them into our models.
Now we do.
The great thing is that he says he will be reporting out based on this during the playoffs!
Has everyone seen this? I’d be interested in your thoughts
The Following 2 Users Say Thank You to DeluxeMoustache For This Useful Post:
I thought we'd have access to some of this data now that everyone is wearing those chips (I think that's what that weird pocket in the back right hand side of the jersey is for).
I thought we'd have access to some of this data now that everyone is wearing those chips (I think that's what that weird pocket in the back right hand side of the jersey is for).
Yeah, I just hope they release the raw data so anyone with time and interest can analyze it. It would help us further discern what's valuable in order to prevent and score goals.
Do they only track speed and identify the player, or can we tell where the puck and everyone is on the ice at any time?
The Following 2 Users Say Thank You to butterfly For This Useful Post:
Yeah, I just hope they release the raw data so anyone with time and interest can analyze it. It would help us further discern what's valuable in order to prevent and score goals.
Do they only track speed and identify the player, or can we tell where the puck and everyone is on the ice at any time?
They have data for all players, plus puck
So they can start to actually measure things like traffic and see how significant they are
(so if you create a pyramid or ‘shot cone’ by drawing a line from puck position to the corners of the net, and count people in that area, it adds context with regards to the challenge for the goalie, which current models lack)
Quote:
Traffic grades out higher when players are within one foot of the straight line between the puck and the chip in the goalie’s sweater (which is being called “possible vision obstruction”).
Then they’re considering how much defensive pressure a shooter is under. They can do that by looking at the six foot radius around each player's jersey chip, and seeing how much (or how many) defensive player chips are interfering with an attempt. To me, this is an area current chance data hasn’t had a chance to fairly evaluate.
Here's an example of a fairly low stress play on an unpressured shot that gets saved – like it’s a really unimpressive clip, I get that – but it has a sneaky high projected goal rate just due to the amount of bodies the goalie has to look through.
Thing is, they should be doing next level data analysis with machine learning - the conclusions they will be able to draw will likely be based on having the vision to articulate the problem plus the computing ability
So they can start to actually measure things like traffic and see how significant they are
(so if you create a pyramid or shot cone by drawing a line from puck position to the corners of the net, and count people in that area, it adds context with regards to the challenge for the goalie, which current models lack)
Thing is, they should be doing next level data analysis with machine learning - the conclusions they will be able to draw will likely be based on having the vision to articulate the problem plus the computing ability
They have a tracker in the puck, and yet still rely on low res low frame rate replays from bad angles to decide if a puck was in the net?
I think they have their priorities messed up here.
The Following 2 Users Say Thank You to Fuzz For This Useful Post:
Will any of this stuff make it to the average fan on free sites? Hard to say.
It seems while the adoption and usage of advanced stats has exploded since the infancy days of Irreverent Oiler Fans/Mudcrutch/etc, the amount of sites with publicly available data has been slowing shrinking.
Will any of this stuff make it to the average fan on free sites? Hard to say.
It seems while the adoption and usage of advanced stats has exploded since the infancy days of Irreverent Oiler Fans/Mudcrutch/etc, the amount of sites with publicly available data has been slowing shrinking.
In 20 years when those are full blown holograms for every road game, I will probably pay to see it once, then get over it.
Well they know the furthest distance from chip to the edge of the puck
So they could tell if a puck is clearly over, as long as the chip is further away from the goal line
There still could be a grey area when the chip is within that distance of the line
Chips in the center of the puck I would imagine, and I also would imagine it doesnt know when the puck is upside down/right side up or in a diagonal position.
I agree someday we will get there with some sort of tech I just think its there right now to track speed and placement.
Look at the game that was on Disney/Amazon using the kids characters and how many glitches there were. Its more for a rough idea of tracking patterns and acceleration rather than exact placement.
I think youd need some kind of mat underneath the ice in the net area along with above in the posts of the net and add at least 4 separate puck sensors placed near the outsides of it to be able to triangulate, and even then the tech would have to be tested for years in all the circumstances with temp/ blocking of people/equipment to see the failure rate.
Will any of this stuff make it to the average fan on free sites? Hard to say.
It seems while the adoption and usage of advanced stats has exploded since the infancy days of Irreverent Oiler Fans/Mudcrutch/etc, the amount of sites with publicly available data has been slowing shrinking.
That's actually pretty cool. I find the idea of going to a stadium with no game being played there kind of silly, but at least that application adds something to it.
__________________
"If stupidity got us into this mess, then why can't it get us out?"
Opportunity Analysis data is unique in that it sorts the factors that had the biggest impact on the likelihood of a shot going in or not, both the positive and the negative. For example, if you had a 2-on-0 that saw a crisp lateral pass followed by a clean one-timer that was taken from around centre ice, there would be a lot of positive factors on that play of course, but the biggest negative factor would be distance from the goal line, and it would kill the “projected goal rate” of that play. In that made-up example, “distance to goal line” was one of the biggest factors.
On eight separate goals the Leafs have scored this series, Vasilevskiy’s angle to the puck has been one of the top-five impacts (out of 25) on an attempt in a negative way. As in, he’s been so square to the shot attempt that it lowers the projected goal rate significantly.
And yet, the pucks have found their way in.
From this sort of fascinating detail, we’re left to draw our own inferences about what’s going on. Watching the goals back – some of which we’ll do together in a minute here – is where we get our teaching point, and is a great example where data and video together can bring us somewhere helpful.
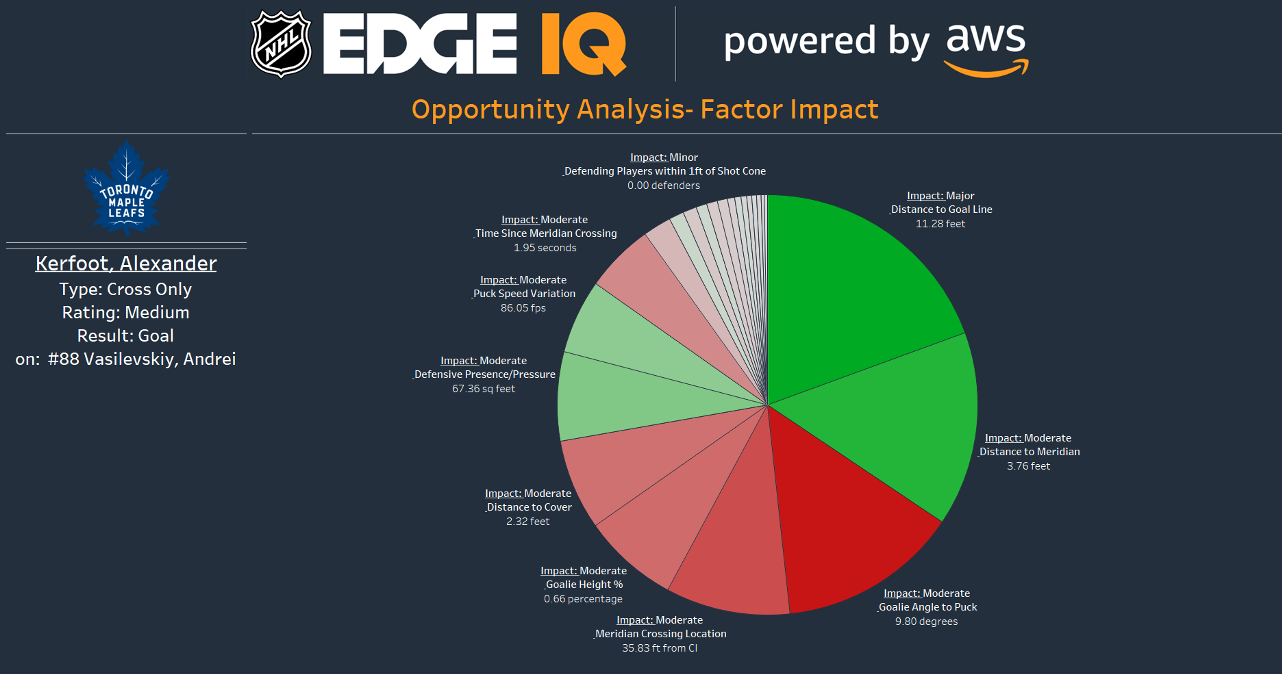
Quote:
For those who really want to dig in on this stuff, here’s a pie chart that shows how the varying factors played out on the Game 4 winner using NHL/AWS data, starting with the biggest ones and working around like a clock to the smaller impacts on the play. The tipped puck and the player standing alone in front show up in “defensive pressure” (there’s none here on Kerfoot at all), and “puck speed variation,” which shows the tip.