|
View Poll Results: What role do humans play in contributing to climate change?
|
|
Humans are the primary contributor to climate change
|
   
|
396 |
62.76% |
|
Humans contribute to climate change, but not the main cause
|
  
|
166 |
26.31% |
|
Not sure
|
  
|
37 |
5.86% |
|
Climate change is a hoax
|
  
|
32 |
5.07% |
 10-30-2019, 11:57 AM
|
#1961
|
|
Franchise Player
|
Quote:
Originally Posted by Scroopy Noopers

How about: China and India are bad so we might as well do #### all. Thats my favourite.
|
That's my go to. Feel free to die on that cross by yourself.
__________________

|

|

|
|
10-30-2019, 12:11 PM
|
#1962
|
|
Powerplay Quarterback
|
Quote:
Originally Posted by Street Pharmacist
Sea levels at the bare minimum will rise enough to displace between 190-340 Million people by 2050. These people will need a place to live, where will they go?
|
Slightly more inland? Really, due to coastal migration there have probably been more than 190 million people who have moved to coastal areas in the last several decades (like the US, and Eastern China), to live by the sea, on the beach or in the most economically vibrant areas.
Quote:
|
Severe weather events will be yearly. Who can live in places with tornados every year?
|

Quote:
|
Category 5 hurricanes every year?
|

Quote:
|
Wildfires burning all the forests?
|
Quote:
|
I feel like when people discuss climate change they aren't internalizing what the future already holds
|
The problem is that the data about extreme events simply don't support these fears.
|

|
|
|
The Following 5 Users Say Thank You to accord1999 For This Useful Post:
|
|
|
10-30-2019, 12:26 PM
|
#1963
|
|
Franchise Player
|
Quote:
Originally Posted by Azure
It gets me every single time I hear the argument that natural gas is bad as well and therefore shouldn't be seen as a clean option. It really is the reason we can't get anywhere.
|
Hmmmm, didn't see that posted anywhere. In fact, just the opposite. We just need to be more aware of the challenges the use of said fuel raises and make sure we use it the right way. Oh, and that extends to our land fill sites, which produce huge amounts of methane and CO2 that are just released into the atmosphere. These could be sources of free energy if we capped them properly and managed the off gassing. If we use our fuels properly, everything is part of the solution!
|
|
|
|
|
10-30-2019, 01:06 PM
|
#1964
|
|
Franchise Player
Join Date: Jun 2004
Location: SW Ontario
|
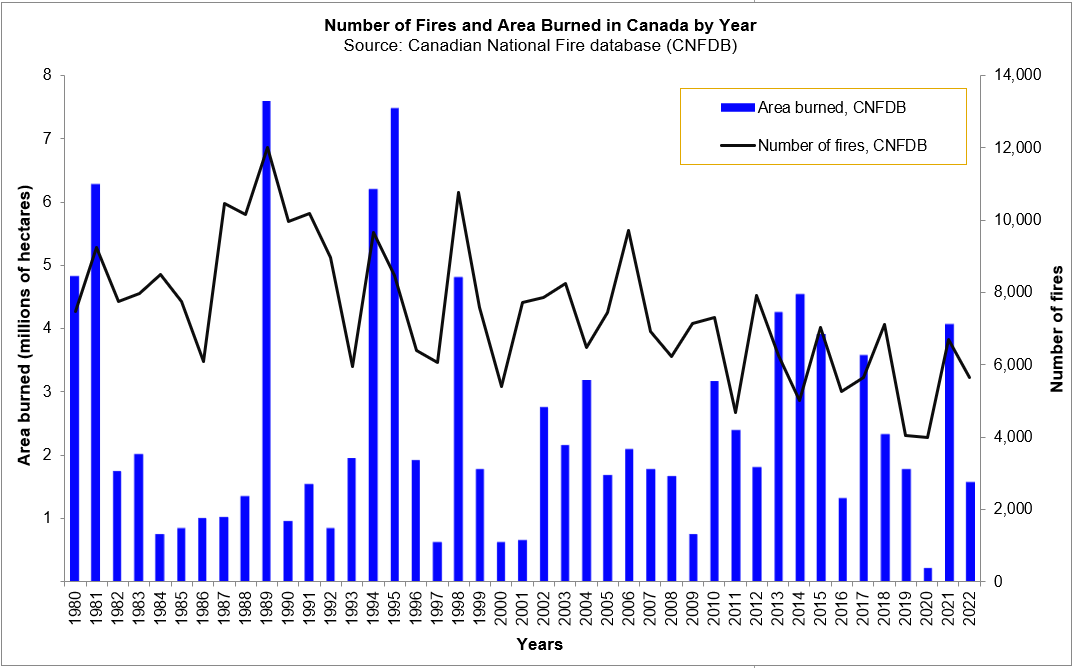
The wildfire chart clearly shows an increase in recent years if you disregard the giant outlier years. Same trend in the US. I'm not going to argue with the rest of the points because they may or may not be true and were also cherry picking the few things on the original list you could dispute and ignored the rest.
https://www.nrcan.gc.ca/our-natural-...st-fires/16392
|
|
|
|
|
10-30-2019, 01:08 PM
|
#1965
|
|
Franchise Player
Join Date: Mar 2015
Location: Pickle Jar Lake
|
Quote:
Originally Posted by PeteMoss
The wildfire chart clearly shows an increase in recent years if you disregard the giant outlier years. Same trend in the US. I'm not going to argue with the rest of the points because they may or may not be true and were also cherry picking the few things on the original list you could dispute and ignored the rest.
https://www.nrcan.gc.ca/our-natural-...st-fires/16392 |
10 years of data for only Canada doesn't really prove anything as far as climate trends go. I believe you need at least 30 years of data to show anything useful, given climate cycles.
|
|
|
|
|
10-30-2019, 01:08 PM
|
#1966
|
|
Franchise Player
Join Date: Jun 2004
Location: SW Ontario
|
Quote:
Originally Posted by accord1999
Slightly more inland? Really, due to coastal migration there have probably been more than 190 million people who have moved to coastal areas in the last several decades (like the US, and Eastern China), to live by the sea, on the beach or in the most economically vibrant areas.
|
Going to have to move pretty far inland
 https://www.nytimes.com/interactive/...e=sectionfront
|
|
|
|
|
10-30-2019, 01:10 PM
|
#1967
|
|
Pent-up
Join Date: Mar 2018
Location: Plutanamo Bay.
|
Quote:
Originally Posted by PeteMoss
|
Only into an entirely different country. No biggie, that always goes smoothly.
|
|
|
|
|
10-30-2019, 01:11 PM
|
#1968
|
|
Franchise Player
Join Date: Jun 2004
Location: SW Ontario
|
Quote:
Originally Posted by Fuzz
10 years of data for only Canada doesn't really prove anything as far as climate trends go. I believe you need at least 30 years of data to show anything useful, given climate cycles.
|
You can use the chart above from accord if you want. 2013, 2014, 2015, 2017 are much higher than normal years.
|
|
|
|
|
10-30-2019, 01:12 PM
|
#1969
|
|
Franchise Player
Join Date: Mar 2007
Location: Income Tax Central
|
Quote:
Originally Posted by Scroopy Noopers
Only into an entirely different country. No biggie, that always goes smoothly.
|
This could have saved a lot of trouble throughout the 1960s.
__________________
The Beatings Shall Continue Until Morale Improves!
This Post Has Been Distilled for the Eradication of Seemingly Incurable Sadness.
The World Ends when you're dead. Until then, you've got more punishment in store. - Flames Fans
If you thought this season would have a happy ending, you haven't been paying attention.
|
|
|
|
|
10-30-2019, 01:16 PM
|
#1970
|
|
Powerplay Quarterback
|
Quote:
Originally Posted by PeteMoss
The wildfire chart clearly shows an increase in recent years if you disregard the giant outlier years.
|
Ignoring data on the assumption that they are "outliers" is also cherry-picking. Truncating data sets to hide earlier data that goes against the theory of things being worse than ever is cherry-picking And if you look at the US, in the 1920s, 30s and 40s, they were regularly experiencing area burn 5x what they are today.
https://www.nifc.gov/fireInfo/fireIn...otalFires.html
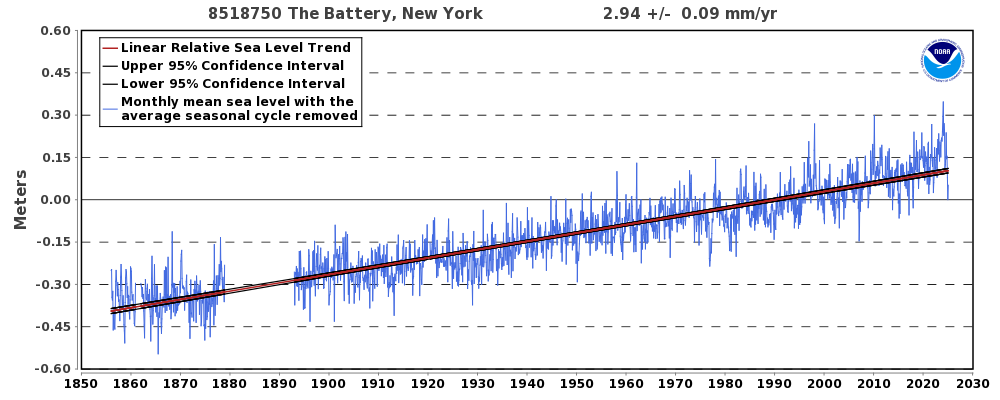
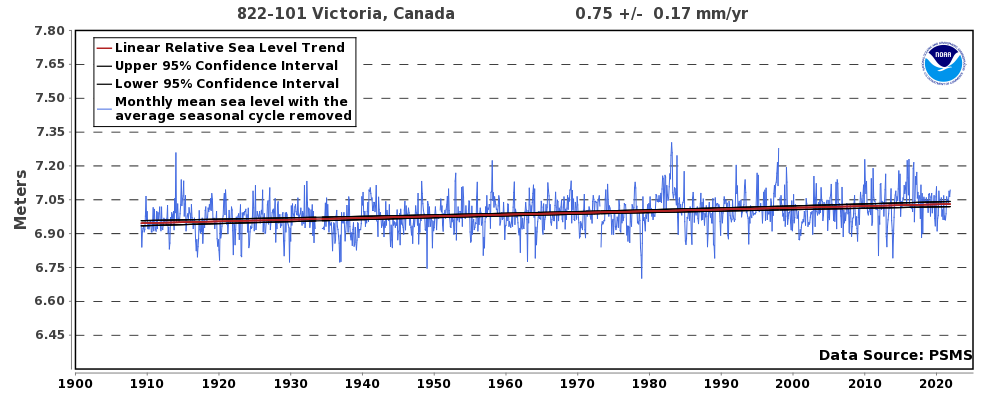
As for the only thing that I didn't go into detail, sea level I assume, where looking at the data for coastal areas, you find that the local trend hasn't change since they started collecting data. For example Manhattan, Victoria ( https://tidesandcurrents.noaa.gov/sl...ltrends.html):
|
|
|
|
|
10-30-2019, 01:16 PM
|
#1971
|
|
Franchise Player
|
Quote:
Originally Posted by PeteMoss
|
When the Mekong delta becomes the Mekong Alpha.
__________________
Quote:
Originally Posted by MisterJoji
Johnny eats garbage and isnt 100% committed.
|
|
|
|
|
|
10-30-2019, 01:18 PM
|
#1972
|
|
Franchise Player
Join Date: Mar 2015
Location: Pickle Jar Lake
|
Ah, see here is a much more useful graph, I don't know why the one at your link is so limited.
 https://cwfis.cfs.nrcan.gc.ca/ha/nfdb
I'm not sure this shows much trend. We have more medium size fires in the past few years, but lacked the monster fires years. Still trough to comment on any type of increasing trend, considering variables like increased population and activity in remote areas, along with changing forestry practices. Pinning whatever you might pluck from the graph on climate change is pretty tough to nail down.
|
|
|
|
|
10-30-2019, 01:32 PM
|
#1973
|
|
Franchise Player
Join Date: Jun 2004
Location: SW Ontario
|
Quote:
Originally Posted by accord1999
Ignoring data on the assumption that they are "outliers" is also cherry-picking. Truncating data sets to hide earlier data that goes against the theory of things being worse than ever is cherry-picking And if you look at the US, in the 1920s, 30s and 40s, they were regularly experiencing area burn 5x what they are today.
https://www.nifc.gov/fireInfo/fireIn...otalFires.html
As for the only thing that I didn't go into detail, sea level I assume, where looking at the data for coastal areas, you find that the local trend hasn't change since they started collecting data. For example Manhattan, Victoria ( https://tidesandcurrents.noaa.gov/sl...ltrends.html):
|
Definitely not cherry picking there. I can go pick some Gulf of Mexico cities and show you the rise if that is needed. Or I can just go look at the overall sea levels globally
https://www.climate.gov/news-feature...obal-sea-level

|
|
|
|
|
10-30-2019, 01:35 PM
|
#1974
|
|
Franchise Player
Join Date: Mar 2015
Location: Pickle Jar Lake
|
The Gulf of Mexico is a really bad example to look at for sea level rise, as it is more of a subsistence of land that is their problem. I think Accord's point is that the long term trend doesn't show an acceleration of rising sea levels in a lot of locations, as is being predicted to occur. Your long term global one shows a slight acceleration.
|
|
|
|
|
The Following User Says Thank You to Fuzz For This Useful Post:
|
|
|
10-30-2019, 01:38 PM
|
#1975
|
|
Franchise Player
Join Date: Mar 2007
Location: Calgary
|
How much sea level rise is attributed to warming vs humans depleting fossil aquifers and the discharge ending up in the rivers then oceans. I can't remember where I read it, but something like 6-8" of sea level rise in the last 100 years was fossil water discharge from humans.
|
|
|
|
|
10-30-2019, 01:40 PM
|
#1976
|
|
Franchise Player
Join Date: Jun 2004
Location: SW Ontario
|
Quote:
Originally Posted by Fuzz
The Gulf of Mexico is a really bad example to look at for sea level rise, as it is more of a subsistence of land that is their problem. I think Accord's point is that the long term trend doesn't show an acceleration of rising sea levels in a lot of locations, as is being predicted to occur. Your long term global one shows a slight acceleration.
|
accord's point is the same in every post. Cherry pick some chart that might throw some doubt on climate change or the O&G industry contribution to it and post it. There's overwhelming evidence to the contrary, but hey 'look at this one data point of Victoria BC water levels' - pretty convincing stuff eh.
|
|
|
|
|
10-30-2019, 01:44 PM
|
#1977
|
|
Franchise Player
Join Date: Mar 2015
Location: Pickle Jar Lake
|
Quote:
Originally Posted by PeteMoss
accord's point is the same in every post. Cherry pick some chart that might throw some doubt on climate change or the O&G industry contribution to it and post it. There's overwhelming evidence to the contrary, but hey 'look at this one data point of Victoria BC water levels' - pretty convincing stuff eh.
|
Instead of being dismissive, can you discuss why if anthropogenic climate change is causing sea level rise, why does your global chart show very little acceleration, and what is the cause of sea level rise at the start of the chart before our emmisions would have caused it?
|
|
|
|
|
The Following User Says Thank You to Fuzz For This Useful Post:
|
|
|
10-30-2019, 01:47 PM
|
#1978
|
|
First Line Centre
Join Date: Feb 2002
Location: Normally, my desk
|
Quote:
Originally Posted by PeteMoss
accord's point is the same in every post. Cherry pick some chart that might throw some doubt on climate change or the O&G industry contribution to it and post it. There's overwhelming evidence to the contrary, but hey 'look at this one data point of Victoria BC water levels' - pretty convincing stuff eh.
|
I don't want to put words in his/her mouth, but I read accord's posts regarding sea level as "yes they are rising, but there doesn't seem to be a change in trend since 1850". Which your overall graph supports.
|
|
|
|
|
The Following 2 Users Say Thank You to Leeman4Gilmour For This Useful Post:
|
|
|
10-30-2019, 01:54 PM
|
#1979
|
|
Franchise Player
Join Date: Jun 2004
Location: SW Ontario
|
Quote:
Originally Posted by Fuzz
Instead of being dismissive, can you discuss why if anthropogenic climate change is causing sea level rise, why does your global chart show very little acceleration, and what is the cause of sea level rise at the start of the chart before our emmisions would have caused it?
|
I'm sure your google works just well as mine.
Here you go - read all 80 pages and let me know your thoughts. Heck it even talks about local readings differing from global. All your concerns will be addressed I'm sure.
https://www.ipcc.ch/site/assets/uplo...er13_FINAL.pdf
|
|
|
|
|
10-30-2019, 02:03 PM
|
#1980
|
|
Franchise Player
Join Date: Mar 2015
Location: Pickle Jar Lake
|
That was a great discussion, thanks. ")
|
|
|
|
 Posting Rules
|
You may not post new threads
You may not post replies
You may not post attachments
You may not edit your posts
HTML code is Off
|
|
|
All times are GMT -6. The time now is 04:27 AM.
|
|


