 11-12-2018, 06:49 PM
|
#61
|
|
|

^ I get what you are saying (a couple of posts up) but correlating goal differential to probability of winning is not that useful either. You have 100 percent probability of winning on a given night if you outscore your opponent.
Goals are a result. What do good teams do to consistently get more goals, though?
I think people are continuing to develop an appreciation of the value of shot based metrics. In this case, Bingo does a great service by presenting the data for consideration.
Does it sound reasonable that shots are a proxy for possession? Sure
Does it sound reasonable that the team with the most possession controls the game and has a higher likelihood of winning? Plausible.
Can you use shot based metrics on an individual player to compare how many shots and scoring chances he generates? Sure
Can the shot metrics distinguish between a cross crease tap in and a puck stuffed in to the goalie’s pad? No, or not necessarily
Does a shot from the so called home plate area have a better chance of going in than an Ovechkin one timer on the PP? Not all shots are made equal.
Can you correlate the outcome of a game to the shot counts? Sometimes. Maybe 55 % of the time? Not in a statistically significant way.
The problem we have with Calgary is that too many times game results, and the eye test, disagree with the inference that you hope you can make from the counting stats. Going by memory, there was a 10 game streak last year where the Flames outshot their opponents on average something like 40-26, and they were getting nothing dangerous, and put up something like a 3-5-2 record over those 10.
Then you had the Hartley years where they gave up a tin of shots from the outside, collapsing and having quick counter strikes with odd man rushes aplenty. Counting stats over the year, and the hypothesis which many want to make, disagreed with the results.
I think by looking at it over many games, you appreciate shot counting stats as data points.
Where things will get interesting is when they get to the point of puck tracking and player tracking. You can then try to categorize situations based on puck movement and play development, and have expected save percentages corresponding to each situation.
I think it’s great to look at counting stats, see what their strengths and weaknesses are, and contemplate how things can be measured better
|

|

|
|
The Following User Says Thank You to DeluxeMoustache For This Useful Post:
|
|
|
11-12-2018, 06:52 PM
|
#62
|
|
Owner
Join Date: Dec 2001
Location: Calgary
|
Honest question ...
if you don't believe in analytics then why do you open topics that are clearly defined as looking at analytics?
|
|
|
|
|
The Following User Says Thank You to Bingo For This Useful Post:
|
|
|
11-12-2018, 07:07 PM
|
#63
|
|
Celebrated Square Root Day
|
I think most are honest in wanting to see it work. I struggle with advanced stats in two ways: a) Understanding and b) straying from the eye test when it paints a different picture than advanced stats suggest.
I guess I shouldn't speak for others, but it's really interesting and exciting that advanced stats are in their infancy in hockey, so I like to pop into any discussion and mostly read along to see where advanced stats go.
Last edited by jayswin; 11-12-2018 at 07:12 PM.
|
|
|
|
|
11-12-2018, 07:23 PM
|
#64
|
|
Owner
Join Date: Dec 2001
Location: Calgary
|
Quote:
Originally Posted by jayswin

I think most are honest in wanting to see it work. I struggle with advanced stats in two ways: a) Understanding and b) straying from the eye test when it paints a different picture than advanced stats suggest.
I guess I shouldn't speak for others, but it's really interesting and exciting that advanced stats are in their infancy in hockey, so I like to pop into any discussion and mostly read along to see where advanced stats go.
|
But wouldn't you say recent games have past the eye test?
Starting against Washington the Flames high danger against stats say they are giving up less ... I think I saw that on the ice.
Last night they had a terrible second period and gave up 8 in those 20 minutes alone ... which I was fully expecting to see given what happened on the ice.
|
|
|
|
|
11-12-2018, 07:24 PM
|
#65
|
|
Scoring Winger
|
The biggest thing I take issue with is when people authoritatively argue against the value of analytics with statements that are factually incorrect.
Making a blanket statement that they have no value because we won 3 games while getting outshot is as ridiculous as the US senator who brought a snowball into the senate to disprove global warming.
I'd also contend that the eye test is incredibly unreliable and inconsistent. Two people can watch the same game and come away with totally opposite interpretations of it, based on their biases going in.
|
|
|
|
|
The Following User Says Thank You to Kovaz For This Useful Post:
|
|
|
11-12-2018, 07:29 PM
|
#66
|
|
|
^ I also struggled with the presentation of advanced stats because of how people (not Bingo, but for example certain people on the radio, and internet bloggers who are super sensitive and can’t take criticism) would after a game, start using them disproportionately, representing them as more important than the facts of a game.
You know, when say, Backlund has a rough game, a couple of turnovers, loses his check on a bad goal, and these ding dongs start going in about how he drove play, had 60 percent of the shots for, and had a strong game.
I actually found the stats (and the application of them to what I had seen) illuminating, but the people who were speaking to them seemed to have watched the game with eyes closed.
And they still do it. (And talk about single game sv% too. Useless stat.)
|
|
|
|
|
11-12-2018, 07:44 PM
|
#67
|
|
Owner
Join Date: Dec 2001
Location: Calgary
|
^ that certainly exists ...
Dougie Hamilton is a good example ... huge underlying numbers but if you don't watch him you may not see he isn't that solid defensively ... or at least to the Norris levels being suggested
|
|
|
|
|
11-12-2018, 08:11 PM
|
#68
|
|
Franchise Player
|
The biggest issue raised in this thread is that per game stats don't correlate with results well, but that's no surprise. I'd suggest you do a moving average over 5 or 7 games to show the trend, which is much more likely to reflect how the team is playing.
|
|
|
|
|
The Following User Says Thank You to edslunch For This Useful Post:
|
|
|
11-12-2018, 09:39 PM
|
#69
|
|
Franchise Player
|
I actually like these graphs and I do find most of the analytics useful (well, a lot of it, actually - some stuff is utter nonsense like those hero charts).
I just wish there was an effective way for counting stats to paint a better picture of the subjective events on the ice, rather than simply counting them equally. I do think there is an attempt to get there, but it seems far from there right now.
I feel like an old tired stubborn mule, but I do think that Hartley's system on the Flames at the time was 'sustainable' simply due to that it was a great system implemented for the talent level of the team at the time. 1.5 strong seasons' worth, anyway. I also find that Gulutzan's system was a terrible fit and that the Flames' success was in large measure also 'sustainable' under that system (or, more precisely, lack of success).
Hartley's system relied on creating high-chance 'red zone' attempts for, while trying to contest as many shots against. When looking at HOW that team was built, one could argue that it had 2 good defencemen (Giordano just really breaking into a legitimate #1 D, and Brodie also emerging) with a Dennis Wideman being relied on to play 25+ minutes a game when Gio went down for a very long stretch...
I honestly do think that some systems can sustainably 'beat' counting stats, and some systems sustainably disappoint even if the counting stats show "should be better".
I do think that if some of you analytic-minded folks get your heads together and reliably assign values to such things as 'contested' vs 'uncontested' shots, and 'goalie having to go side-to-side to make a huge save', maybe a '5 fricken jam the net shots'... and include these with the current analytics, I do think that it could provide stronger correlation.
Some nights the counting stats will just be off (and sometimes way off) simply due to a goalie playing out of his mind. Those will always be outliers.
What I hated last season was the constant "Flames are on the verge" talk when the eye test told me that they weren't being 'unlucky', but rather that their chances for (including the high danger chances) were not of great quality. Even when these high danger chances for last season was way in Calgary's favour, I argued that the chances against were of even better quality (uncontested, sometimes cross-crease tap-ins where Smith had to make a crazy save to stop, etc), even if they were lower in volume.
That's always the toughest part of objective analytics though, isn't it? Assigning consistent and reliable values to things that are subjective. Heck, something that constitutes a hit varies wildly from arena to arena, and even things like shots were not universal from arena to arena, right?
I do think that stats can and often do correlate really nicely with the data that you are seeing, but I also think that there are examples when they are proven rather unreliable consistently due to different systems employed by teams with differing amounts of talent.
I can't say that I have disagreed with any of the games that these charts are representing yet that Bingo has been posting. It has - for the most part - been matching my eye test. Even if they weren't 100% matching, I am sure at least some of the individual columns would be describing what I am seeing well enough.
Know what this tells me? That the Flames are a team with solid talent playing a system well (for the most part, ignoring a couple of obvious games in which they didn't play well), and that this system is more conducive to creating higher (real?) danger chances for which is helping align the 'what you see is matching what the analytics is saying'. Just my guess anyway.
|
|
|
|
|
The Following User Says Thank You to Calgary4LIfe For This Useful Post:
|
|
|
11-13-2018, 07:38 AM
|
#70
|
|
Owner
Join Date: Dec 2001
Location: Calgary
|
Quote:
Originally Posted by Calgary4LIfe
I do think that if some of you analytic-minded folks get your heads together and reliably assign values to such things as 'contested' vs 'uncontested' shots, and 'goalie having to go side-to-side to make a huge save', maybe a '5 fricken jam the net shots'... and include these with the current analytics, I do think that it could provide stronger correlation.
What I hated last season was the constant "Flames are on the verge" talk when the eye test told me that they weren't being 'unlucky', but rather that their chances for (including the high danger chances) were not of great quality. Even when these high danger chances for last season was way in Calgary's favour, I argued that the chances against were of even better quality (uncontested, sometimes cross-crease tap-ins where Smith had to make a crazy save to stop, etc), even if they were lower in volume.
That's always the toughest part of objective analytics though, isn't it? Assigning consistent and reliable values to things that are subjective. Heck, something that constitutes a hit varies wildly from arena to arena, and even things like shots were not universal from arena to arena, right?
I do think that stats can and often do correlate really nicely with the data that you are seeing, but I also think that there are examples when they are proven rather unreliable consistently due to different systems employed by teams with differing amounts of talent.
I can't say that I have disagreed with any of the games that these charts are representing yet that Bingo has been posting. It has - for the most part - been matching my eye test. Even if they weren't 100% matching, I am sure at least some of the individual columns would be describing what I am seeing well enough.
Know what this tells me? That the Flames are a team with solid talent playing a system well (for the most part, ignoring a couple of obvious games in which they didn't play well), and that this system is more conducive to creating higher (real?) danger chances for which is helping align the 'what you see is matching what the analytics is saying'. Just my guess anyway.
|
If the NHL goes through with the player tracking system they are discussing they should have a huge jump in validity. You'll have goalies showing they moved within a second of a player shooting in an area on the ice deemed dangerous ... as an example.
I watch a lot of games late because of my kid's hockey so I can't check stats during the game for fear of seeing the final score. As a result I go eye test through the game without the ability to see if the counting stats are going the same way. Then the game is over and I sit down to finish up the game story and I check the metrics ... 90% of the time it matches what my eyes were telling me.
Last year I saw a Flames team (especially on home ice) that came out hard, looked like the better team faced adversity and failed, and then played catch up (score effects) for a lot of the night. So the early was fine, the implosion was a mess, and then of course they'd have good metrics because they're home and losing.
|
|
|
|
|
The Following 2 Users Say Thank You to Bingo For This Useful Post:
|
|
|
11-13-2018, 08:36 AM
|
#71
|
|
Franchise Player
|
right now these stats are much more closely correlated to actual winning % then they were last year.
Last year the Flames were pretty much elite in possession stats and not that close to being a play off team.
Right now the Flames are #10 in the league standings and #4 in SAT %.
Carolina is 1st in SAT % and #17 in league standings.
The thing is that the league standings are so close that right now the Flames are both contenders for the elite 8 that start playoffs at home and a top 10 draft pick.
Nashville the class of the league is 11th in SAT% . LA the clear cut last place team is #15 in SAT %.
In the big picture the possession stats is more highly correlated to playing with the lead as opposed to chasing a game. Teams trailing have much more shot attempts than teams protecting a lead.
|
|
|
|
|
11-13-2018, 10:38 AM
|
#72
|
|
Powerplay Quarterback
Join Date: Jun 2008
Location: the RR diner
|
Quote:
Originally Posted by squiggs96
I never once made fun of someone for spending time on stats. I even said he obviously doesn't need my permission to spend his time however he wants. I also said I've taken multiple advanced statistics classes, so I'm well versed in how they work. I didn't know spending five minutes typing a reply was long winded. I learned something new today..
|
You threw shade. Call it what you will.
__________________
Harry, I'm gonna let you in on a little secret. Every day, once a day, give yourself a present. Don't plan it, don't wait for it, just... let it happen. Could be a new shirt at the men's store, a catnap in your office chair, or... two cups of good, hot, black coffee.
|
|
|
|
|
11-15-2018, 12:41 AM
|
#73
|
|
Franchise Player
Join Date: Jan 2014
Location: Toronto
|
I love data and graphs and such, so I love that you put this stuff up for us. Don't necessarily understand it though because I haven't spent the time to actually read up on it, so your explanations help.
|
|
|
|
|
The Following User Says Thank You to activeStick For This Useful Post:
|
|
|
11-15-2018, 09:05 AM
|
#74
|
|
Franchise Player
Join Date: Oct 2014
Location: Springbank
|
Quote:
Originally Posted by DeluxeMoustache
^ I also struggled with the presentation of advanced stats because of how people (not Bingo, but for example certain people on the radio, and internet bloggers who are super sensitive and cant take criticism) would after a game, start using them disproportionately, representing them as more important than the facts of a game.
You know, when say, Backlund has a rough game, a couple of turnovers, loses his check on a bad goal, and these ding dongs start going in about how he drove play, had 60 percent of the shots for, and had a strong game.
I actually found the stats (and the application of them to what I had seen) illuminating, but the people who were speaking to them seemed to have watched the game with eyes closed.
And they still do it. (And talk about single game sv% too. Useless stat.)
|
Yeah, advanced stats for a single game are not useful at all.
Last game someone was keeping a running score of Smith's save% during the game in the GT. Of course, after a while that ended because a .928% didn't fit the narrative.
|
|
|
|
|
12-02-2018, 11:54 AM
|
#75
|
|
Owner
Join Date: Dec 2001
Location: Calgary
|
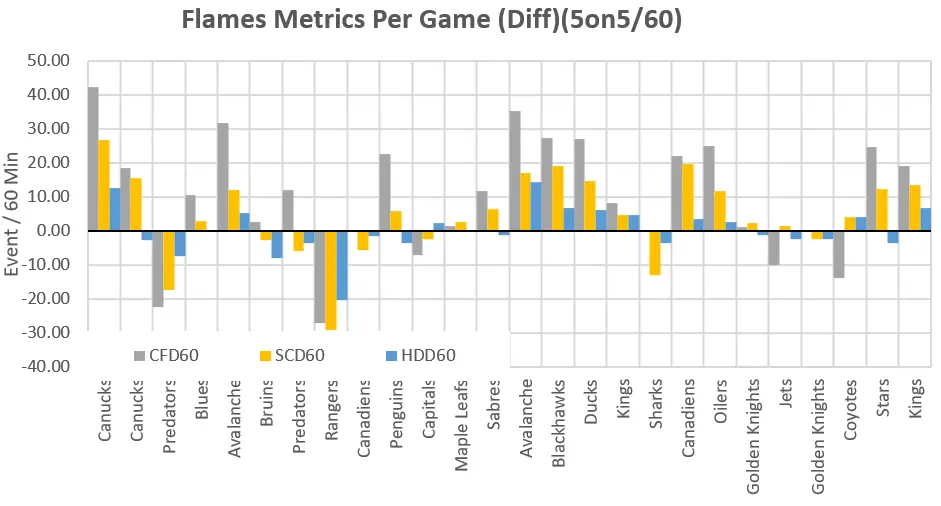
Updated ...
quite a run of solid hockey since the Pittsburgh/Washington games
Everything upward is good, downward is bad
|
|
|
|
|
The Following 2 Users Say Thank You to Bingo For This Useful Post:
|
|
|
12-02-2018, 12:04 PM
|
#76
|
|
Franchise Player
|
Sometimes these stats are so bizarre.
Against the Knights (1st game) and the Yotes, the Flames won by a combined score of 13-3. Yet looking at these stats, you would think they were totally even games.
You would also think we blew out the Stars
|

|
|
|
12-02-2018, 12:15 PM
|
#77
|
|
Owner
Join Date: Dec 2001
Location: Calgary
|
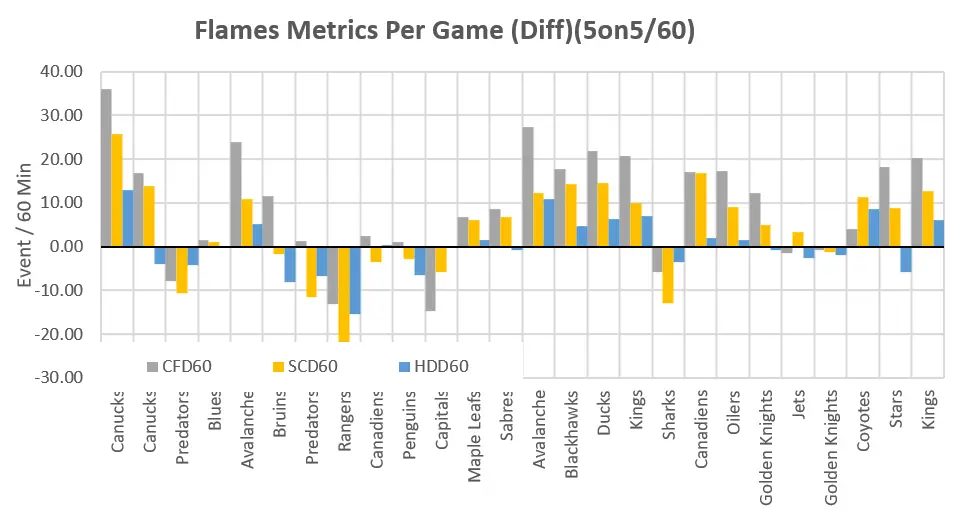
Here it is score adjusted ...
shows higher for recent games where the Flames had big leads for example
|
|
|
|
|
The Following User Says Thank You to Bingo For This Useful Post:
|
|
|
12-02-2018, 12:17 PM
|
#78
|
|
Owner
Join Date: Dec 2001
Location: Calgary
|
fits my eye test which is the only poor game the Flames have played defensively in a long while is the San Jose game
|
|
|
|
|
12-02-2018, 12:18 PM
|
#79
|
|
Franchise Player
|
Yeah, the score-adjusted one looks a lot more like how they have played for the past month.
10-4-1 in their last 15, and playing with some big leads.
|
|
|
|
|
12-02-2018, 12:26 PM
|
#80
|
|
Franchise Player
Join Date: Sep 2015
Location: Paradise
|
Quote:
Originally Posted by Bingo
fits my eye test which is the only poor game the Flames have played defensively in a long while is the San Jose game
|
The last Vegas game wasn't very good defensovely as well. But that shows on the chart too.
|
|
|
|
 Posting Rules
|
You may not post new threads
You may not post replies
You may not post attachments
You may not edit your posts
HTML code is Off
|
|
|
All times are GMT -6. The time now is 09:20 PM.
|
|


