Related aside:
I did a sort of forensic study on an agri-food production plant in the Calgary area a couple years ago, basically critiquing the work of another mechanical engineer who designed the HVAC system. In the summer of 2021 they'd lost weeks' worth of batches of product because it got too hot inside the facility. I went through all the calculations, and found nothing 'wrong' with it at all: the problem was the building and its HVAC system were justifiably never designed for 36+ °C outside.
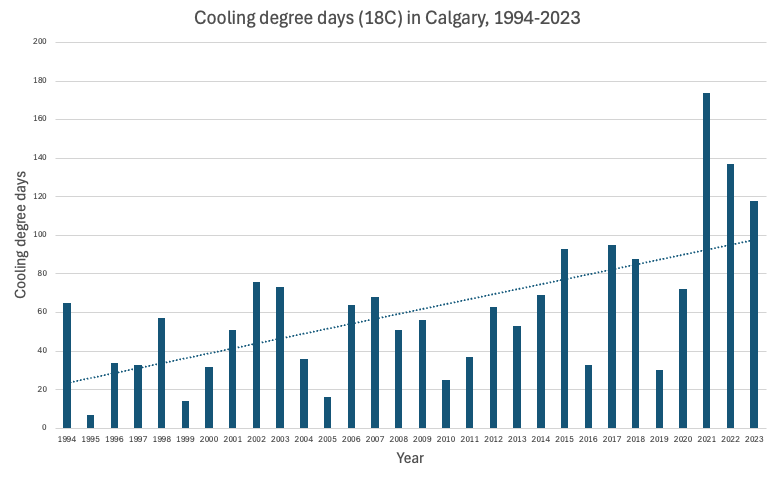
In the course of compiling this report I did my own analysis of the cooling degree-days (CDD) in Calgary, which that chart above graphs going back to 1994. Cooling degree-days are defined (in Canada) as the difference between the mean temperature on a given day and a comfortable baseline of 18 °C (hypothetically at which you need neither heating nor cooling). So for example yesterday's high temperature was 26.8 °C, the low was 13.3 °C, so the mean is (26.8 + 13.3 ) / 2 = 20.05 °C, and therefore it represents ~20 - 18 = 2 cooling degrees for that day. Heating degree-days (HDD) are likewise the opposite: 18 °C minus the mean temperature. CDD and HDD are basically broad analogues for how much energy we need to keep buildings at a comfortable temperature for human occupancy. They're used in our building codes; for example, we use HDD for determining the baseline amount of insulation you need in a wall or roof. A house somewhere on Vancouver Island needs a lot less insulation than a house in Winnipeg, for instance.
For this report, I did my own weather data analysis going back 50 years from 2021 through 1971 with whatever I could get from Environment Canada. There were a few gaps, but the average annual CDD I calculated was in the mid-40s, I can't remember the exact number off-hand. Standard deviation was in the low-20s.
I do remember
precisely how many CDD we had in 2021 though: 174. Far, far and away the most we've ever had in recorded history. (As reflected on the chart above.) At the time, the second-worst year was 2017, third was 2015, and fourth was a tie between 2018 and 1971. Those other years were about two standard deviations higher than the 1971-2020 average; 2021 was almost
six.
Here's a fun stat: we had more cooling degree-days in the summers of 2020, 2021 and 2022 combined than we did in the entirety of the 1990s.