 04-28-2023, 06:03 PM
|
#19
|
|
|

Some excerpts from the instalment.
Quote:
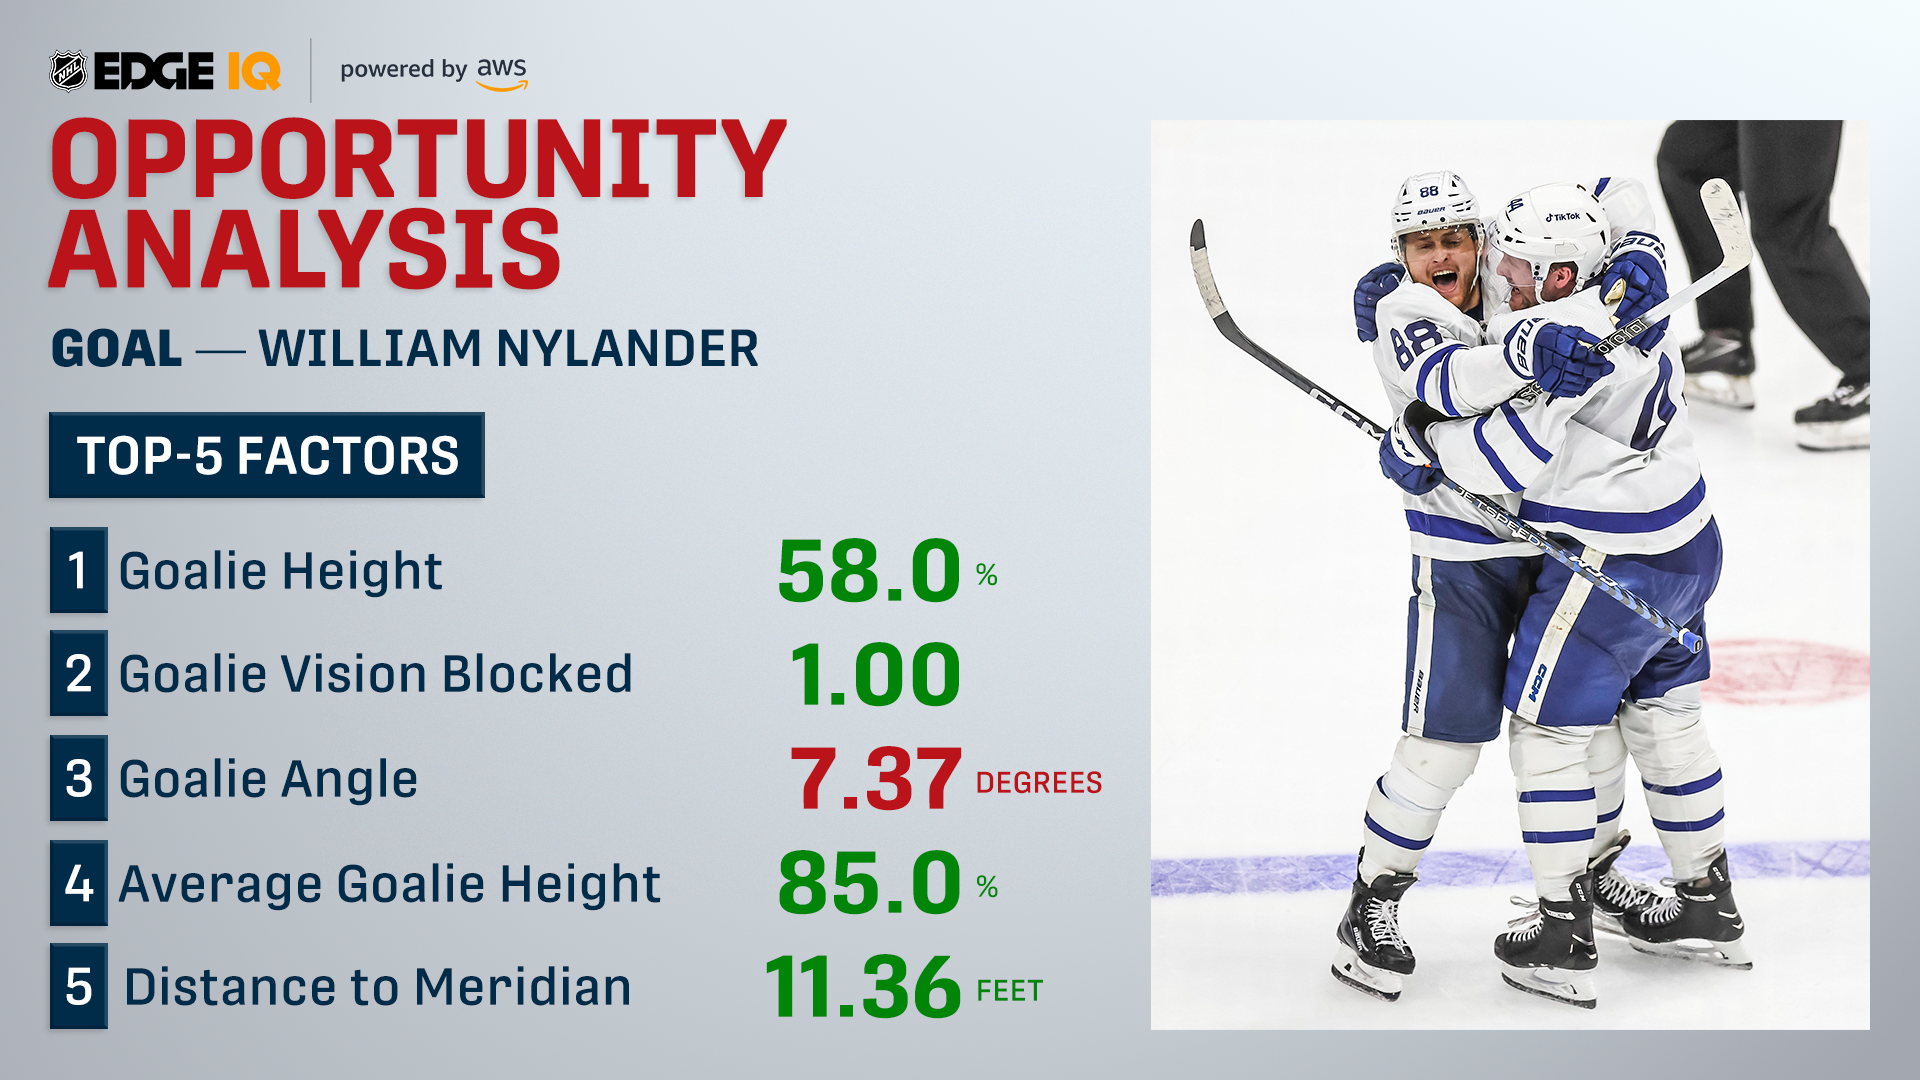
Opportunity Analysis data is unique in that it sorts the factors that had the biggest impact on the likelihood of a shot going in or not, both the positive and the negative. For example, if you had a 2-on-0 that saw a crisp lateral pass followed by a clean one-timer that was taken from around centre ice, there would be a lot of positive factors on that play of course, but the biggest negative factor would be distance from the goal line, and it would kill the “projected goal rate” of that play. In that made-up example, “distance to goal line” was one of the biggest factors.
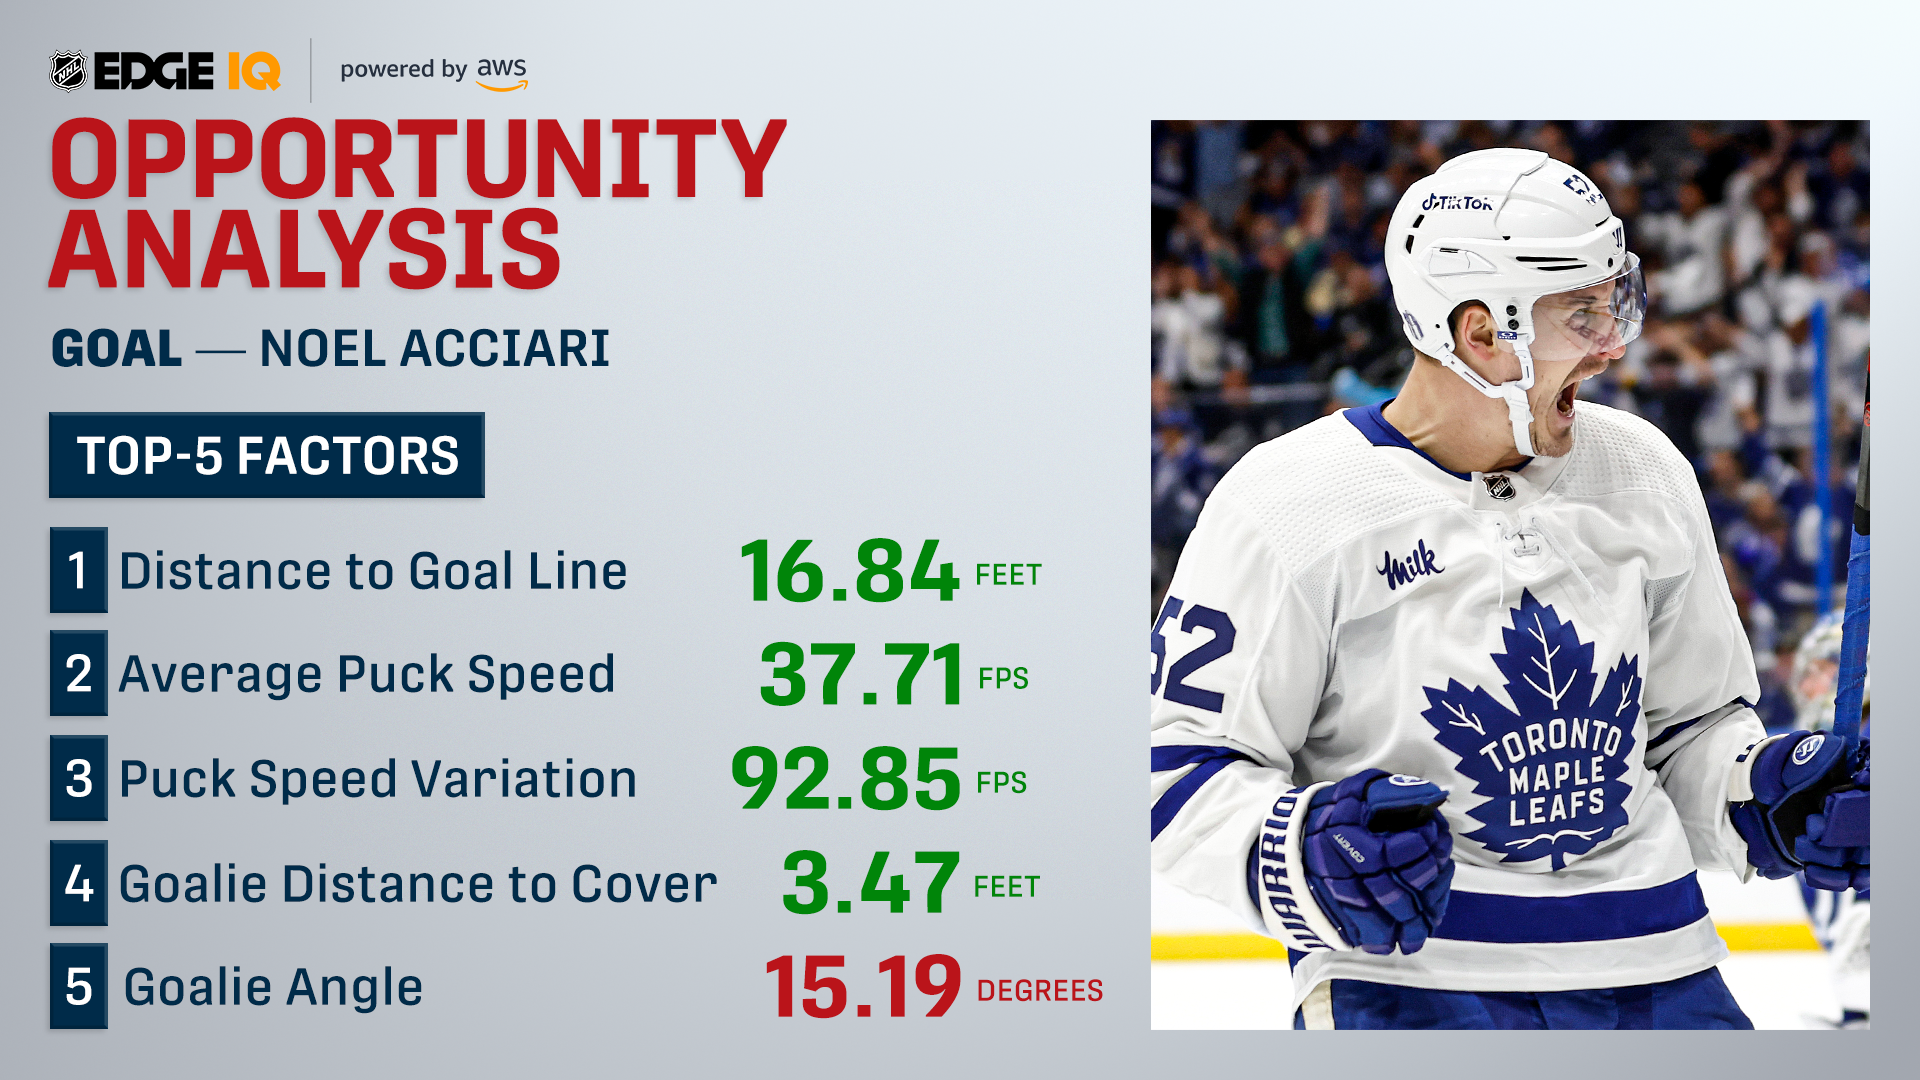
On eight separate goals the Leafs have scored this series, Vasilevskiy’s angle to the puck has been one of the top-five impacts (out of 25) on an attempt in a negative way. As in, he’s been so square to the shot attempt that it lowers the projected goal rate significantly.
And yet, the pucks have found their way in.
From this sort of fascinating detail, we’re left to draw our own inferences about what’s going on. Watching the goals back – some of which we’ll do together in a minute here – is where we get our teaching point, and is a great example where data and video together can bring us somewhere helpful.
|
Quote:
|
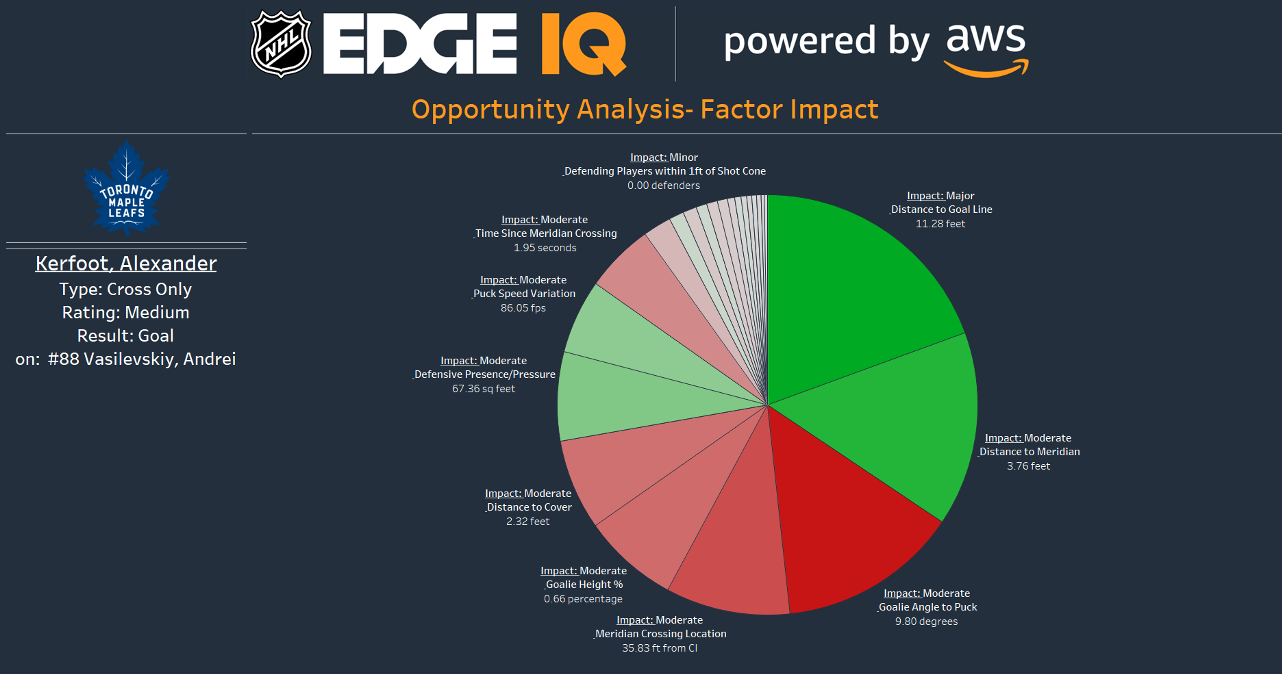
For those who really want to dig in on this stuff, here’s a pie chart that shows how the varying factors played out on the Game 4 winner using NHL/AWS data, starting with the biggest ones and working around like a clock to the smaller impacts on the play. The tipped puck and the player standing alone in front show up in “defensive pressure” (there’s none here on Kerfoot at all), and “puck speed variation,” which shows the tip.
|
|

|

|