Quote:
Originally Posted by PeteMoss

I do think those charts do have limitations unless they are stripping out the impact of teammates. Does Nurse have those giant offense numbers without McDavid?
|
Not only do they account for quality of teammates, it's actually listed right on the card along with quality of competition. Short version is Nurse plays with the best players against the opposition's best players - no surprise there.
The charts do have significant limitations, though, for sure... The biggest one is that while they're expressed as percentages, the scale isn't linear. The on-ice impact difference between a player at 99% and a player at 90% is very large, while the difference between a player at 30% and one at 20% is very small.
But that's the tradeoff for having that much information in one tight, easy-to-read package. You can quickly see, "okay, this guy gets better results than 80% of players when he's on the PK". If you want to dig deeper, there's plenty of information you can look at to understand what's behind those PK results, but you'll have to get into the weeds.
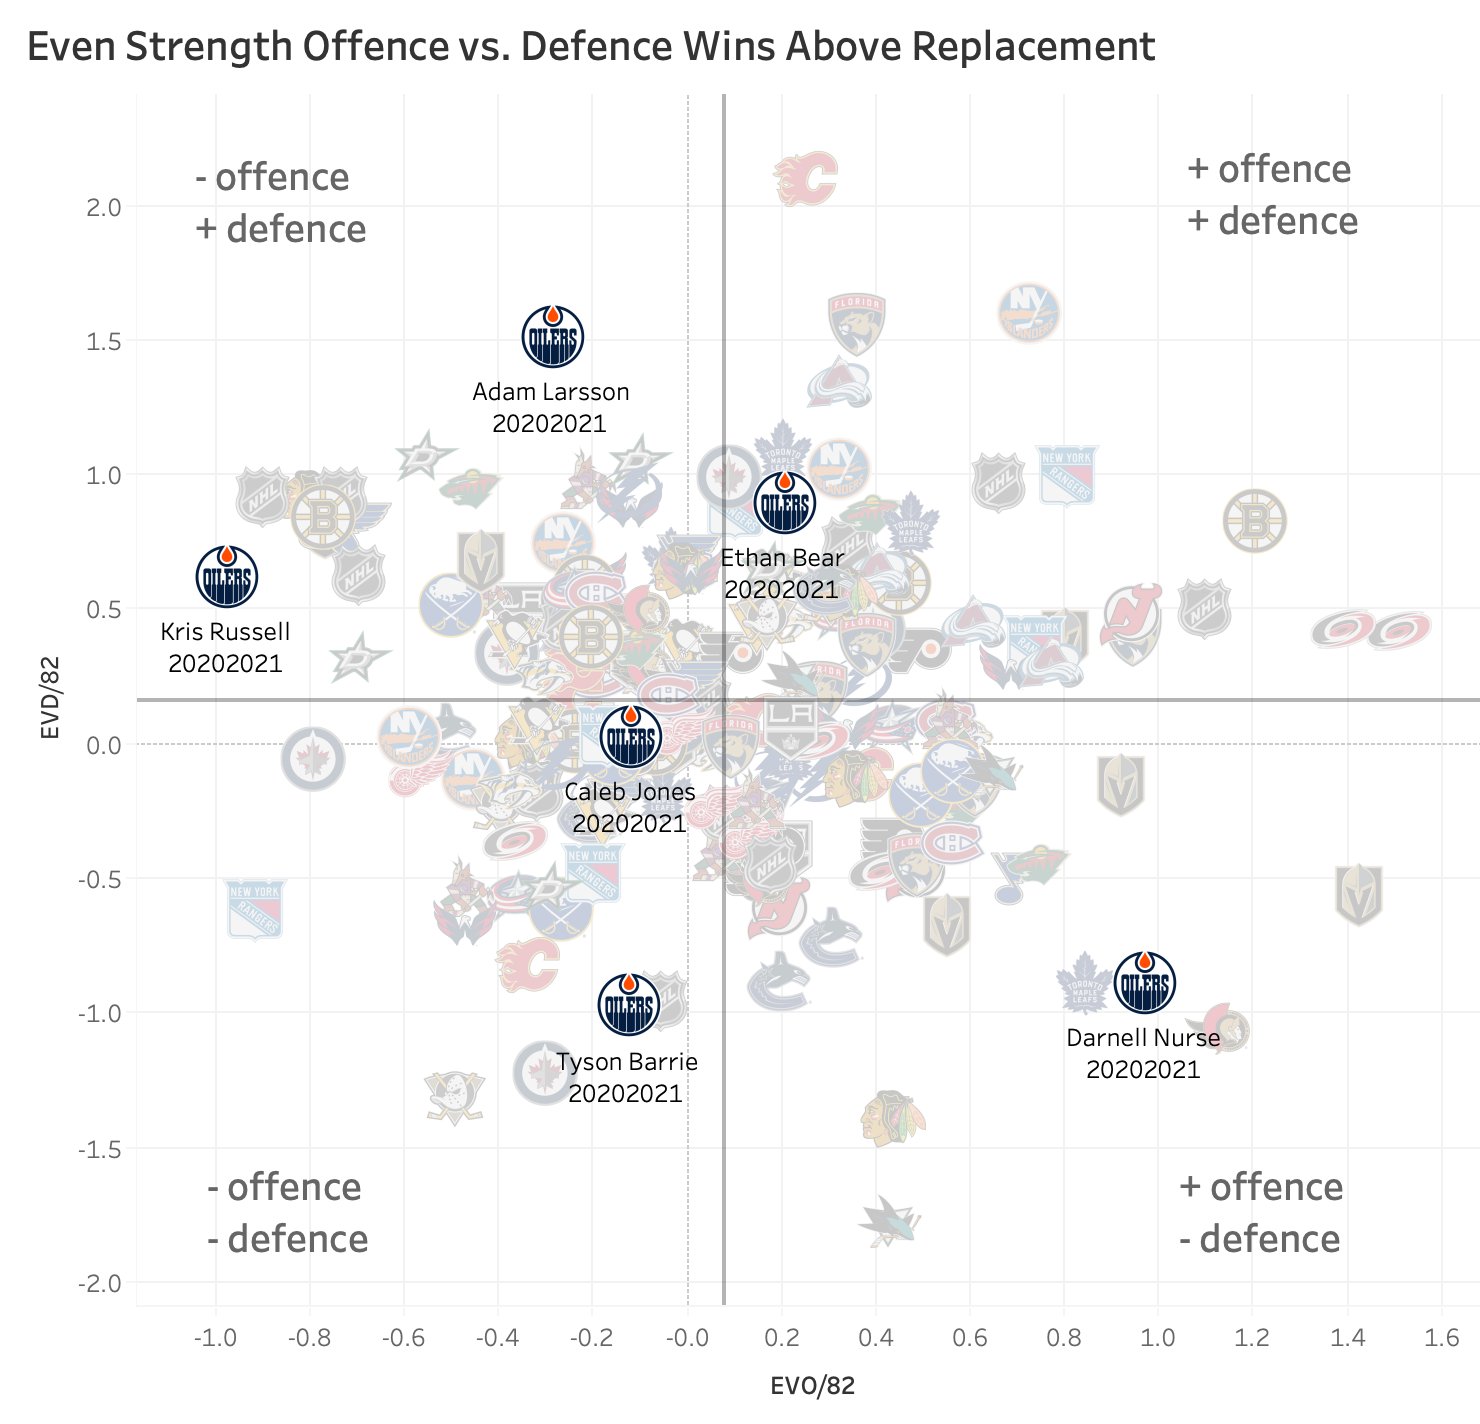
He also makes good charts. Here's one showing that Ethan Bear (AKA the guy they just traded) was the only d-man they had last year to show positive results in both offence and defence and that Adam Larsson (AKA they guy they lost in free agency to Seattle) was by far their best defensive d-man:
Also, just for fun:
https://twitter.com/user/status/1424775210956468232