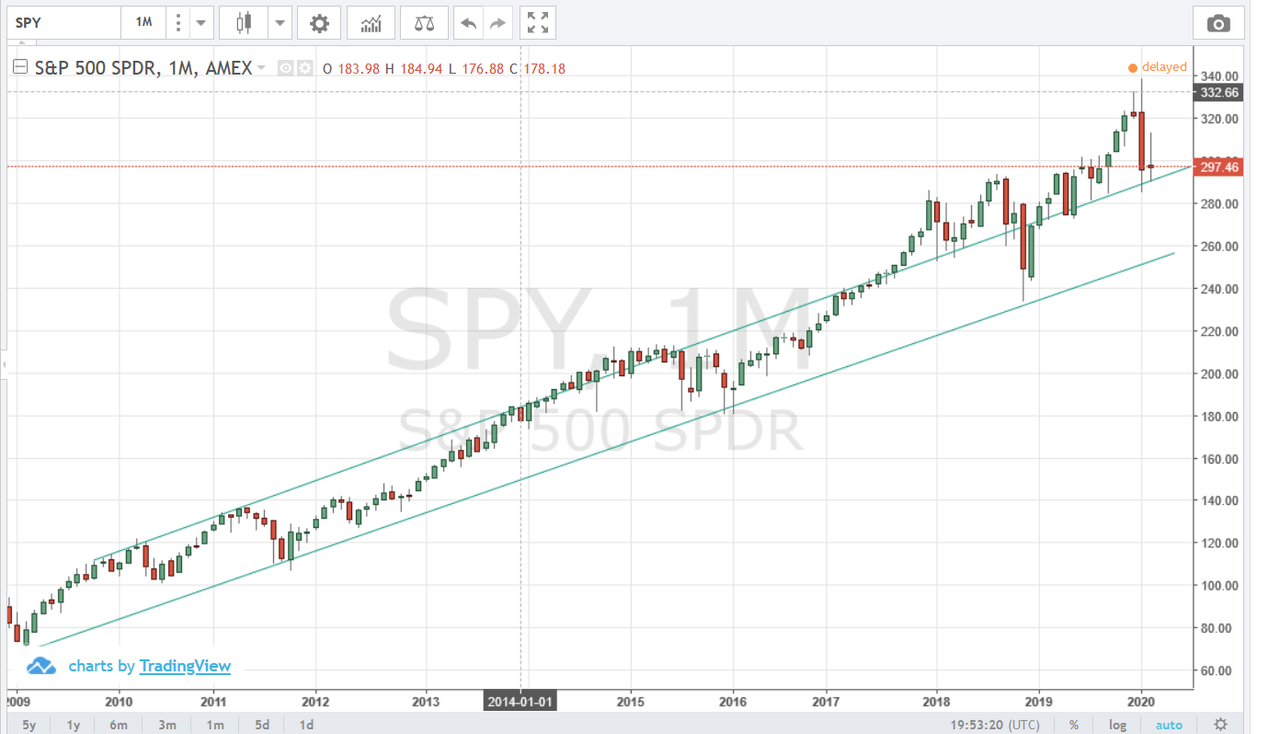
I don't like posting charts cause it's still considered voodoo. But it helps to see the big picture. This charts starts in 2009 at the bottom of the financial crisis 11 years ago. On Friday we were still above what would be considered normal for the last decade. Now we're right in the middle of the channel at 275. I suspect we'll fall to the bottom of the channel. We'll probably start seeing some better virus news and then continue to meander up the well established price channel. If we fall out of the channel, below 260 we're likely in for some prolonged suffering.